Geomarketing analysis of the Healthy Food network
Key notions for analysing, optimising, and extending your distribution network

Workshop led by Cindy Pinheiro Gomes
The five steps we follow in this workshop to build your geomarketing analysis are:

About Healthy Food
Healthy Food is a «high end» fast food restaurant chain.
Healthy Food offers ‘a la carte’ menu options, and uses exclusively local and organic foods.
Menu options: salads ~ burgers ~ vegetarian dishes.
Only a few tables are present for in-house diners, the majority of customers opting for takeaway meals.
Healthy Food has been operational in France since the year 2000, and now has 110 restaurants.
Background and context for the analysis
With the aim of continuing to extend and develop their existing business, the Healthy Food restaurant chain hopes to improve on profitability for its restaurants, increase customer footfall, and identify sites with potential for new restaurant business.
The core strategic customer target for the chain is regular business from the mainstream population of employed inhabitants. For the purpose of our study that sets out to accurately identify the right zone(s) for new restaurant sites, we dispose of a sample of 12 restaurants in the South East of France, these being a representative sample of existing restaurants.
The territory of action is located in the PACA region. Here, there are some 194 living areas including Marseille, Nice, Toulon, Avignon, Montpelier… On our various maps, you can see the road network, certain topographical features, and administrative boundaries.
Attributed data are associated to the various map objects: for example population, age, number of sites or retail outlets.
These information items are sourced by the cartographic database Here, from INSEE (L'Institut national de la statistique et des études économiques, LSA (Local Search Association) databases, Indigo…
Other information will be calculated within the Geoconcept database to complement the data, so you can be sure you have all the information you need to produce a comprehensive analysis.
Taking the Healthy Food analysis as starting point, you will discover all the steps to take and the questions you need to ask at the outset.
The Healthy Food analysis is constructed as follows in three stages:
1 – Current situation analysis
Analysing the existing scenario provides a state-of-the-art snapshot view of current supply and demand. Before embarking on the analysis, you will need to position all players currently present on the ground playing any kind of role in the activity, and as a minimum:
- customers;
- stores or outlets;
- the competition.
Mapping the locations of these types of player means we can already start to answer the following questions:
What is our network coverage?
Where is the competition?
Where are our customers located?
And more generally, we can answer the question of what positioning the business has in the geographic space.
2 – Targeting market zones or territories
Knowing which traffic generators are relevant to the study is necessary if we are to be able to site store or business premises as near as possible to focal points for potential customer traffic, and so to attract the largest possible customer footfall. It is at this stage of the analysis that we will need to cross data to determine which zones feature all indicators generating most customer traffic.
3 – Applying a development strategy
Once the relevant zones have been identified, we need to validate on the ground the development strategy to apply (how many openings, search for premises….).
Study zone: South East region of France
In the first instance, the study will concentrate on the South East region of France (including the history of past sitings of Healthy Food restaurants) and subsequently apply the results obtained at the scale of the whole of France.
In effect, whatever the study, it is always preferable to take a representative sample, as this will make data collection interpretation of the results easier. It will then suffice to apply this study more widely.
Stage 1: Current situation analysis
Choice of a grid to use for the analysis
Administrative boundaries
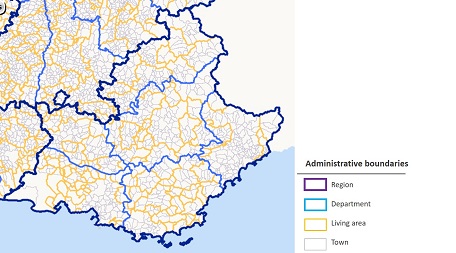
The choice of an analysis scale is crucial in any geomarketing study. By scale, we mean the size of mesh or grid, corresponding most often to an administrative boundary. We will need to choose a reference administrative boundary as a function of its coverage on the ground, its implantation but also depending on available data at this scale.
For example, if your business is over-represented in one town, opt for the study at IRIS level. Conversely if you don’t need such precise localisation, opt for a breakdown by town or region.
In the case of Healthy Food, the market zone, also called living area, is the most suitable unit of space to analyse because it concentrates on a real life area of habitation where people live, work, and consume.
Definition of the living area according to INSEE: "The breakdown of France «into living areas» has been applied to facilitate our understanding of the structure of the French metropolitan territory.
The living area is the smallest territory on which inhabitants have access to the full set of standard, current installations and services.
The infrastructure of services and businesses underpinning life in the community serving to define living areas has a classification under 6 major headings:
- services to individuals
- commerce
- education
- health
- sports, leisure and culture
- transport
Localisation of existing sites
This first step is essential to take account of the geographic coverage currently covered by existing business.
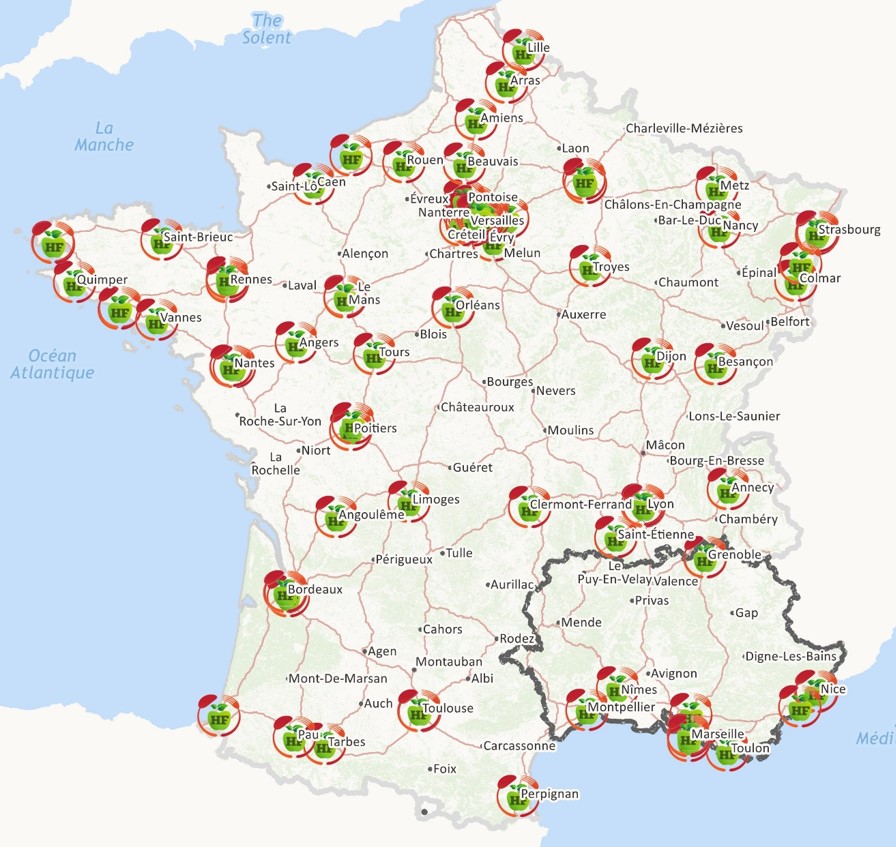
Starting from postal addresses, the geocoder enables exact positioning of 110 restaurants on the map.
We can already see, in the form of the white zones around major cities such as Avignon, Bourges, Montauban, areas where the business is not currently present.
Healthy Food: a national chain
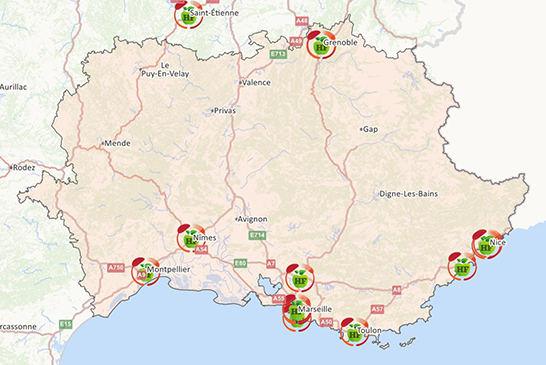
If we are more interested in one particular area, the South East of France for example, a thematic analysis in colour ranges will allow us to highlight those living areas covered by the Healthy Food chain.
Healthy Food has a strong presence in Marseilles and in Nice, unlike the living area of Avignon, that does not include a single retail outlet.
Density of the competition
Density of the competition
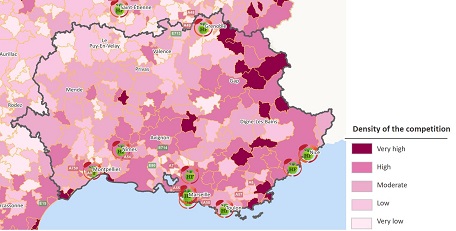
Notice that the zones served by Healthy Food are characterised by a high number of competitor outlets. At this stage of the analysis, we cannot know whether it would be wise or profitable to site a new business in the zones where the competition is very weak, or very strong. We need to complete these results by analysing the demand that exists in these areas.
It is rare to find a business sector where an absolute monopoly prevails. We need, therefore, to analyse the competition, and find out who will share the market with you. Like you, they are included in, and are part and parcel of, the supply element in any analysis. The objective is to discover and highlight those areas where supply is not sufficient to fulfil demand.
In the case of the Healthy Food chain, competitors are other fast food chains (offering snacks, fast food, bakeries, cafes…). To increase the level of precision in the analysis, a weighting is applied to each competitor type (we have identified 3) as a function of their characteristics. For example, take-away pizza chains have less impact on the business of Healthy Food than a sandwich bar or a supplier of ready meals.
The density of the competition for each living area has been calculated in the following way:
Density = nb of households / (nb of competitors (type1) x1 + nb of competitors (type2) x0.4 + nb of competitors (type3) x0.1)
Target market analysis
To analyse the demand on the ground and know your target market, it is vital to know the characteristics of your customer base.
Today there are numerous tools that allow us to gather information about customers (loyalty cards, customer satisfaction surveys, social networks...).
The aim is to define a typology for your customers: sex, age, socioprofessional category), where they live, consumer behaviour, purchasing power…
Thanks to an analysis of the information provided by its loyalty cards, Healthy Food has defined a profile type for its customers. Below are the customer demand characteristics identified:
- employed or self-employed;
- relatively high income bracket;
- propensity to seek out quality foods (organic or with high nutritional content);
- take away service during the working day lunch hour.
To address all these aspects of customer demand, we will target employment areas and zones where management and intermediary professions have the highest representation.
We will proceed first to analyse the employment statistics by living area and then perform another analysis to determine the proportion of those employed that belong to the socioprofessional+ category.
Representation of employment pools
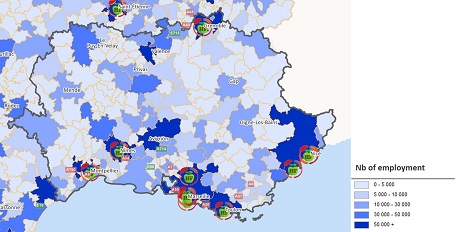
This first analysis of demand confirms the best places to site Healthy Food restaurants. We find that they are indeed located within the main employment areas. However, we can already see that the zones of Avignon and Valence have 50,000+ employees and are not served by the presence of the restaurant chain.
Proportion of population per living area in the salaried socioprofessional category
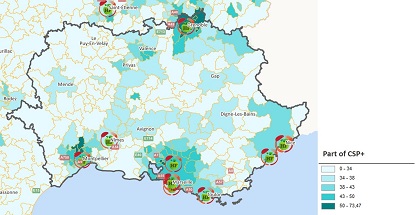
This second analysis shows which areas fulfil the criterion of a strong representation in the workforce population of salaried socioprofessional and higher level workers. The target zones cited earlier in the study are confirmed.
The zones of interest are the living areas where the target clientele is present, and the number of competitors is low. If demand is high and supply is weak, then this zone will potentially be a zone with high potential for the Healthy food chain. Thanks to our analyses of supply and demand, the zones offering most potential can be identified.
Stage 2: Targeting market zones or territories
Analysis of traffic generators
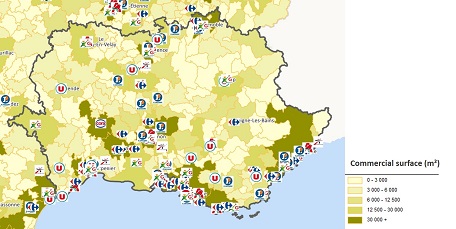
Hypermarkets and commercial centre footprints in the South East of France
Qualifying your customer base is important, but in itself not enough. Other factors come into play: for example, when setting out to site a new business outlet, you need to make sure you are close by other traffic-generating infrastructures, focal points for large numbers of potential customers.
We will search for zones where the presence of a driver entity (a store or commercial centre that itself has a very high footfall) will increase frequentation by consumers generally.
For Healthy Food, the commercial centres appear as service centres that generate high footfall and ideal sites for opening any kind of store.
There are large numbers of suppliers of data on this subject, each of them specialised in a particular business area. For the purpose of our study, we will focus on the localisation of hypermarkets, (in France, these might include Casino, Auchan...) and the presence of shops (supermarket areas) located within identified living areas, commercial centres (commercial surface) in the living areas.
The analysis shown opposite highlights the same «white» zones as the analysis of the employment statistics for salaried individuals. We can therefore surmise that these variables are correlated: in the zones where there is a high level of commercial surface, a high proportion of the population is employed.
This analysis confirms that the zones of interest cited earlier of Avignon and Valence offer a commercial surface of more than 30,000m2 and the presence of several hypermarkets.
Calculating a score on key indicators
Definition of a score: "allows you to synthesize different indicators to obtain a score that can be attributed to a target (in this instance, the living area). This score will therefor provide a measure of the uptake potential for the supply offered by the Healthy Food chain. The score obtained will translate the probability that the zone belongs to the target zone sought”
To recap on the indicators for our different analyses, we have:
- employment statistics;
- the proportion of salaried socioprofessional and higher level employees;
- the density of the competition;
- commercial surface;
- the number of hypermarkets.
To enrich the analysis and establish a scoring, we recommend adding other variables (for example, age…).
To establish the score with greatest precision, each indicator must be weighted as a function of its impact on revenue generated by existing Healthy Food restaurants. This weighting coefficient can be found with the help of an explanatory analysis such as, for example, a Principle Component Analysis (PCA) using the Modeler Analyser application.
* To find out more about how Modeler Analyser operates and the different methods used for analysis, refer to the Spatial Datamining workshop.
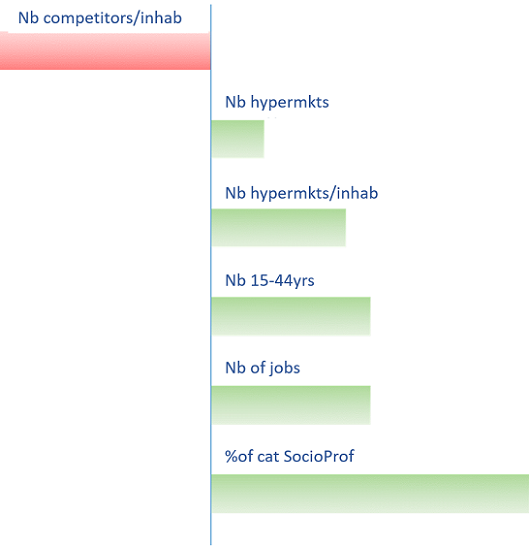
Having performed the analysis, we obtain the following hierarchy:
Score = Nb hypermkts x 0,5 + Nb hypermkts/inhab x 1,25 + Nb 15-44yrs x 1,5 + Nb of jobs x 1,5 + % of cat SocioProf+ x 3 + Nb competitors/inhab x (-2)
Applying the scoring to living areas
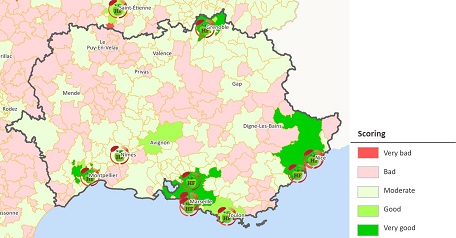
The thematic analysis allows you to represent the score obtained on each living area. Avignon stands out as the only zone where the score is qualified as being ‘good’, and where there are no sitings of the Healthy Food restaurant. Again, the score confirms and refines our search for zones of interest where a new restaurant might profitably be opened.
Mesuring potential
As the analysis is refined, it becomes clear that arguments in terms of Euros are required. In effect, even if the target zone brings together all the indicators favouring an opening of a restaurant, we need to know that the revenue from such an operation will be sufficient to justify the investment.
Starting from consumer data, and more generally, from the catering sector, we can obtain an untapped market share potential.
Details of the calculation:
[ Potential expenditure on eating out ] x [ Estimated market share for the zone* ] - [ Turnover already achieved on the zone ]
* Estimated market share for the zone = Average market share for Healthy Food nationwide weighted by the score
* Potential expenditure on eating out = nb of competitors / estimated dining-out cost per household
* Revenue already achieved on the zone = average turnover of a Healthy Food restaurant
Potential untapped market share (in Euros)
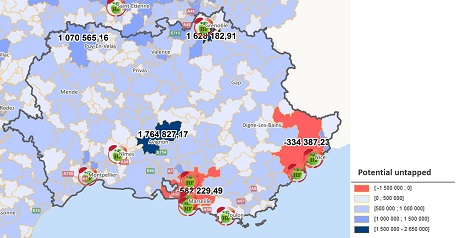
By comparing the thematic analysis of the score and that of the untapped market share potential, we obtain a different map. In effect, Marseille, that appeared to have a score of «very good» appears here in the red zone with a negative untapped market share potential, which can also be explained by the strong presence of competitors and of several Healthy Food stores. Conversely, the living area of Avignon reveals an untapped market share potential of 1,700,000 euros and a score of “good”.
To sum up on all the analyses, Avignon appeared as the most interesting zone, as it ticked the boxes for all the favourable indicators for opening of a new Healthy Food restaurant.
Stage 3: Applying a development strategy
Assessing candidate sites
Once the target zones have been selected, we now need to validate your strategy on the ground.
Healthy Food wants to extend its network without knowing the exact number of restaurants to open. Thanks to the calculation of the untapped market share potential, it is possible to find out how many candidate sites are real possibilities.
Healthy Food considers it is necessary to have a turnover figure of 500,000 euros to enable the opening of a restaurant.
Avignon offers a potential of more than €1,700,000, and so a potential for opening 3 restaurants. Healthy Food wishes to remain prudent and only open 2 restaurants.

Choosing a new business site
Application of the scoring on IRIS entities
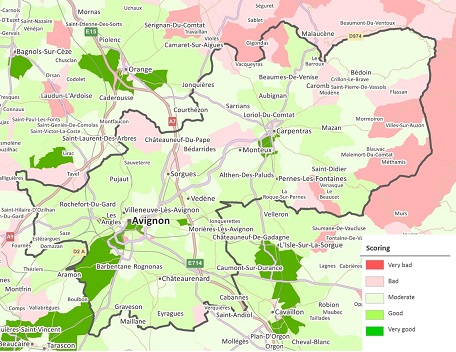
To refine the analysis, you will need to change the grid and refine the analyses on IRIS entities and no longer on living area.
Definition of an IRIS entity: "Towns with less than 10,000 inhabitants and most towns of 5,000-10,000 inhabitants are divided up into IRIS entities. This breakdown, the base grid for publication of infra-communal statistics, constitutes a territory breakdown of towns into «districts» with a population of the order of 2,000 inhabitants. France has about 16,000 IRIS entities of which 650 are DOM (overseas territories or ‘Domaines Outre Mer’) according to INSEE."
Two IRIS entities in dark green obtain a score of «very good»:
- the IRIS of Carpentras;
- the IRIS of the South West of Avignon.
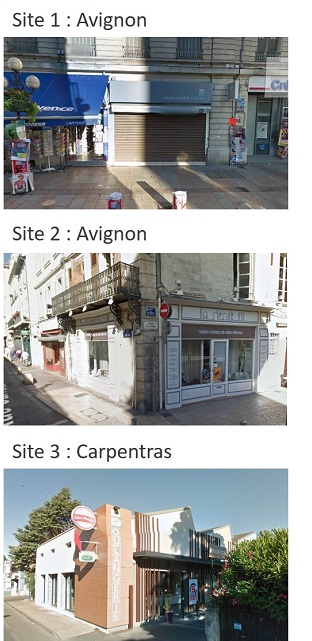
Following searches on the ground in these 2 IRIS entities, Healthy Food selected 3 premises or locations that would fulfil the desired criteria.
Estimating achievable revenue
To be sure only 2 locations for premises are selected out of the 3, we will make a more precise estimation of the turnover by simulating the opening of a restaurant in each locale.
Using Modeler Analyser, we apply a predictive model for revenue based on explanatory variables (refer to workshop Datamining spatial) for each site.
We obtain the following results:
- site 1 at Avignon: €387,000
- site 2 at Avignon: €524,000
- site 3 at Carpentras: €646,000
The price of the second property in Avignon makes this option unsuitable.
Healthy Food will therefore follow a strategy of opening 2 restaurants: one at Avignon, and another at Carpentras, where there are options to acquire and fit out premises that correspond well to the different development criteria identified by Heathy Food’s development strategy.
On your marks...Ready ?...Enjoy, and Bon appetit !!!
Taking the next step
You now have all the keys you need to construct a study designed to guide you in developing your distribution network.
Keep bearing in mind the main points that are vital for this kind of study: state-of-the-art of your network / analysis of the environment / analysis of supply and demand / application of the right strategy on the ground.
A well-founded methodology combined with Geoconcept solutions are 2 key ingredients to ensuring your geomarketing study carries weight, and can be relied on.
Other studies could be useful to complement the analysis:
- Identify any zones where the market is saturated (for example Marseille for Healthy Food installed in a zone where the untapped market share is negative) :
- Analyse the turnover of restaurants on the zones where existing restaurants are operating with difficulty (implementing an aggressive pricing policy and/or promotional events…);
- Identify instances where a restaurant might be usefully transferred somewhere else (opening or closing a site);
- Target zones with strong customer potential, or sales campaign.