Generating reports as decisional aids
See for yourself how reports can be used as decisional tools, and get to know your way around the Reports module environment.

Workshop led by Zoé Gonnon
This workshop follows five main stages:
A few essential principles - Reports and GeoBI
Reports is an add-on module for Geoconcept designed to service the area of GeoBI: it creates reports that integrate both business data and geographic data to provide a new perspective conducive to decision-making.
The module is specifically adapted to answer strategic problem-solving while automating to the maximum study models applied to one or several marketing territories. It allows you to handle as much geomarketing problems (searching for sites for new points of sale, grid analyses, sectorisation or redistricting studies…) as surveys for land occupation or land-use management (flood plain boundaries for a given territory, implementing a territory atlas, study of socio-demographic criteria…).
Its strength depends on its adaptability: a study model created for a branch office or a territory may subsequently be applied automatically to other branch offices: text, maps, tables or graphs that are constituent elements of any study model are updated (enriched text, zoom-in on the branch or territory in question, update of data contained in the graph or table…).
Reports is therefore an engine for generating strategic studies and analyses that can be rapidly applied to the whole of the territory (sectors, towns, IRIS...) or of the objects concerned (branches, customers, prospects…).
Philiosophy behind the Reports module
What are Reports?
The Reports module is designed to generate reports on full studies by following a protocol of automation, in order to:
- Integrate updates and refresh any studies screated previously;
- Generate a document that is personalised for the territory concerned. The report model creates on a town or a zone of action or again the study of a branch and of its environment can be applied automatically to other towns or branch offices.
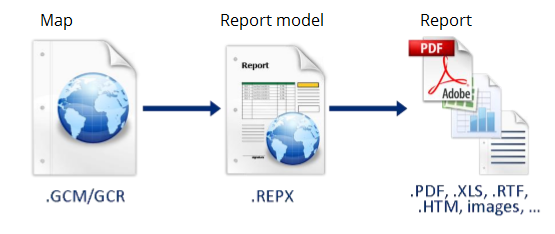
Publishing a report model articulates around 2 main stages:
- Design a report model;
- Generate the model.
Architecture of a report model
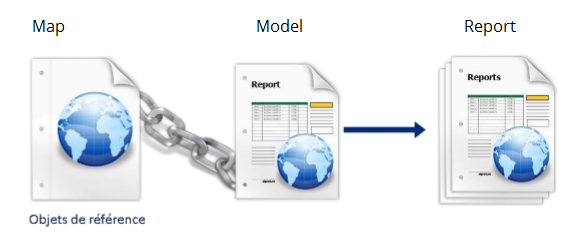
- A report model is always created from a Geoconcept map : if the user modifies the reference objects (polygons, lines, points) or their data, the report generated will be affected.
- The report model is abased on a reference object that belongs to an « information layer » (Class/Subclass of the Geoconcept map currently being used). For the report to be able to be applied to all the objects in this reference Class/Subclass, the reference objects must have established relationships with the other objects on the map (topological, attributed…).
Building a report model
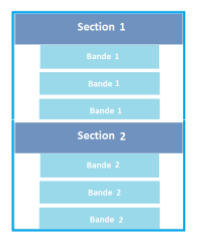
A model is made up of sections, bands, and blocks:
- Section: this is a series of bands. Their properties are configurable and can be applied to all their constituent bands
- Band: it alone can contain blocks. It is the chaining of these bands (these, too, are configurable) that constitutes the report model.
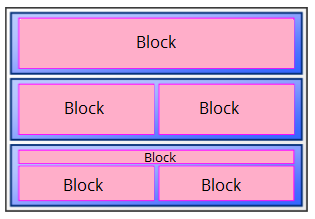
A report model is the result of a particular arrangement of constituent sections and bands.
- Blocks: these are nested within bands. They may be of different kinds: map, text, table, graph, legend, image, page number…
Each block has configurable properties that are specific to that block.
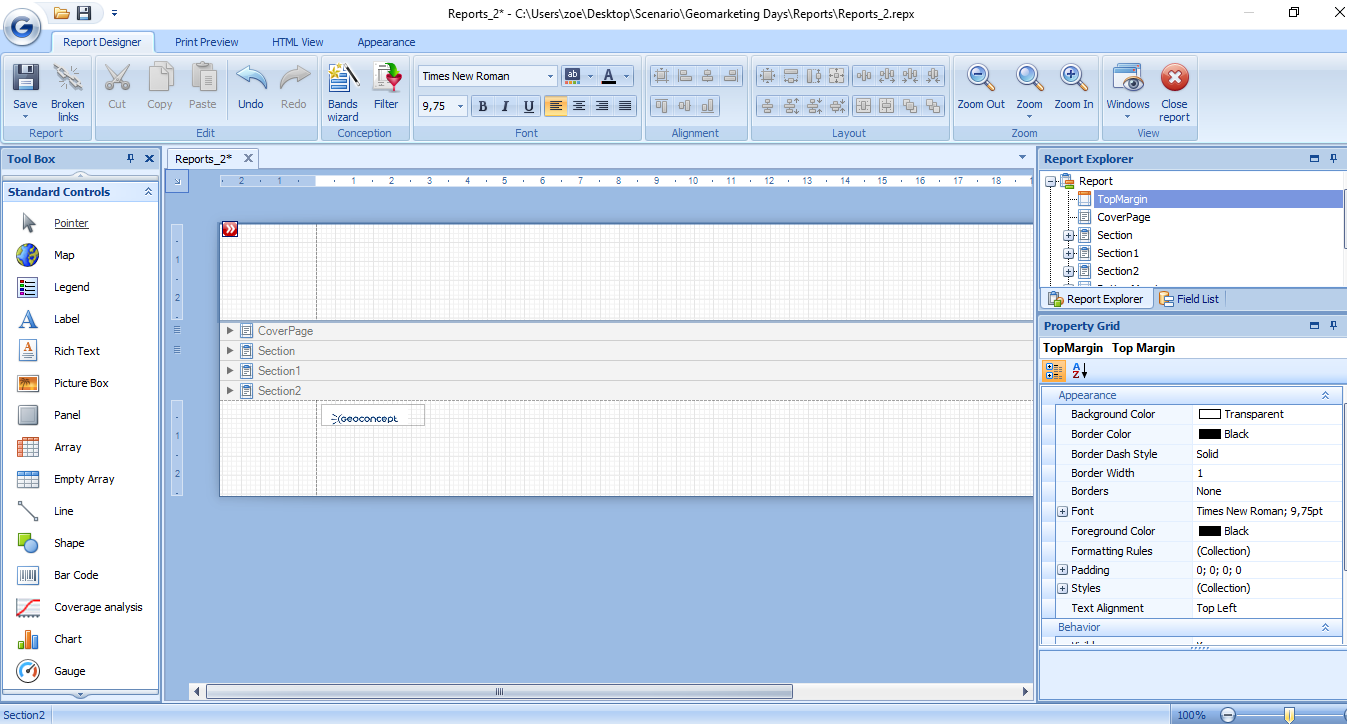
A report model depends on the succession and arrangement of sections, bands, and blocks. The Reports interface breaks down into 3 parts:
- On the left: the « standard controls » window follows the same operational behaviour as the page layout: it allows you to select a block to add with a definition of its imprint on the page;
- In the centre: the work page, on which we position and modify the arrangement of blocks, bands, and sections;
- On the right: the properties window thanks to which we configure the properties specific to each block.
A concept essential to capital function: the filter
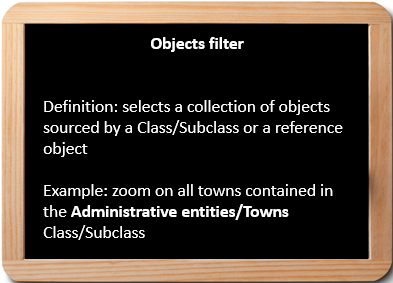
A filter allows you to select one object or a collection of objects to fill a table (a Class/Subclass) in the report. It can be used to select objects so they can be viewed on a map, or inserted in a table or graph.
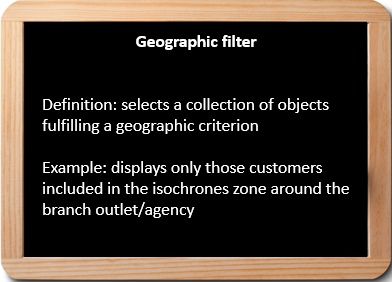
In the framework of an isochrone study zone for a bank branch, we can choose to only see on the map those customers contained in this zone, and to only display information relating to these customers in a table.
Several filters can be configured for just one block, and hence the importance of superposing them one over the other according to a particular deployment strategy.
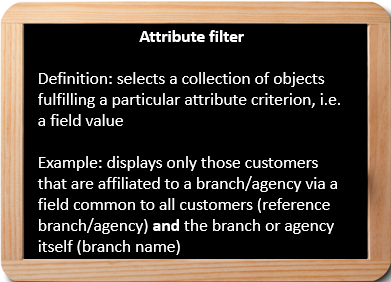
In the framework of our isochrones study zone, we can choose to only display customers contained in the zone (first filter) who are affiliated to the branch by a special code (second filter).
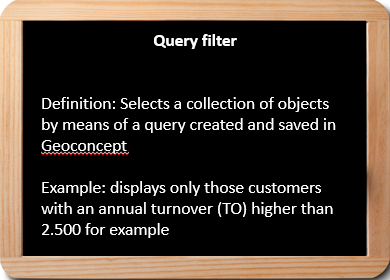
There are 4 filters:
First steps in Reports
Before running the sreports module, it is essential to select an object in the reference Class/Subclass being used as an example.
The bands wizard offers predefined dispositions for blocks. We can add to these manually.
Each block is configurable, for example :
- The text block’s font and colour, border colour (…);
- The map block’s zoom, filters, visibilities (...);
- Displays, colours, sizes (…) for the cells in the table block
- ...
The report’s Design tab allows you to develop the model, the Print preview shows the result on the reference Class/Subclass
Adapting a map to the study content
The attribute filter allows you to only retain he isochrone, the name of which is strictly identical to that of the branch.
A filter allows several actions:
- select,
- hide,
- display;
- colour objects.
It is essential to create topological or attribute relationships between the reference object and the Classes/Subclasses of the objects to display in the report so they can be easily manipulated.
In the video, we configure an attribute filter on the map block, in order to only see the customers of the branch with whom our study is concerned. To do this, we define the Class/Subclass to which the filter will apply (the customers), and the filters which allow linking of customers to the branch (Branch of affiliation for customers / Name of the branch for the points of sale).
Enriching the cartographic report with data organised in a table
The table of data lists a series of objects defined by one or several filters (so that we only see information relating to customers affiliated to the reference branch in the framework of the study, for example). The number of lines varies as a function of the number of objects selected by the filter.
In the example opposite, we limit the data from the table to customers who are affiliated to the branch being studied, and we only display those fields that present interest in the framework of our study. A summary line allows us to apply operations such as add, average, minimum… to the fields of customers taken into account.
There are 2 types of table in Reports:
- the table of data;
- the summary table, that presents summary information for fields of selected objects via one or several (obtain, for example, the account of customers affiliated to the reference branch, the sum of turnover or revenue figures…). The number of lines in this table will therefore always remain constant.
Taking it one stage further
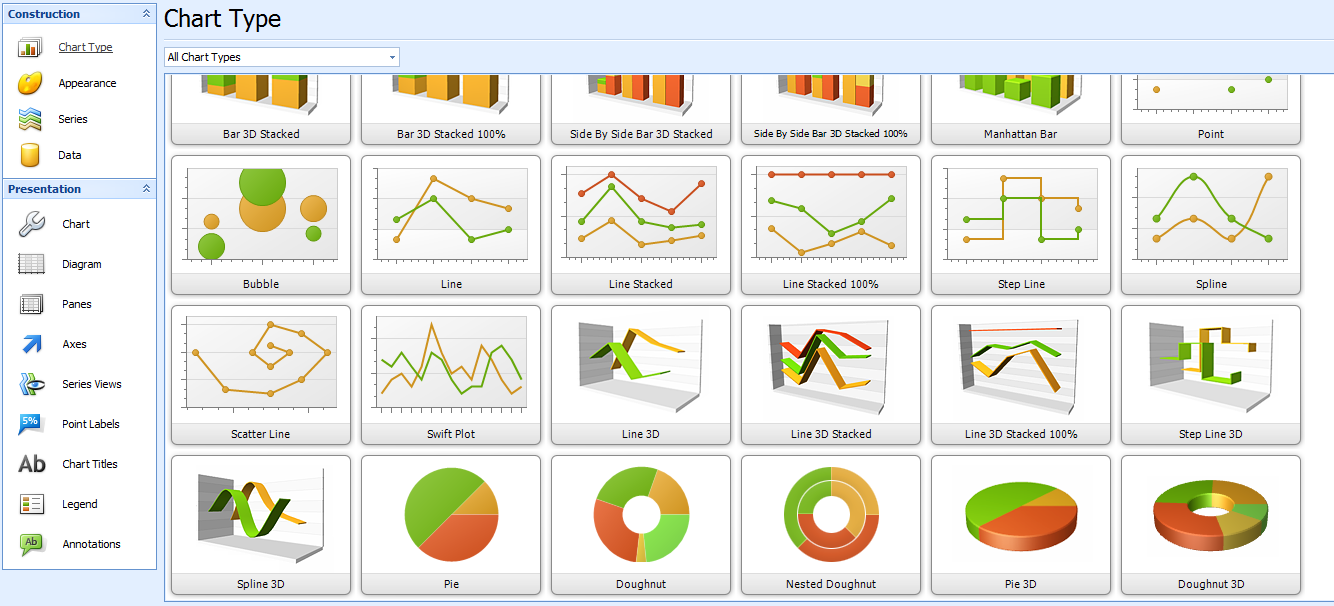
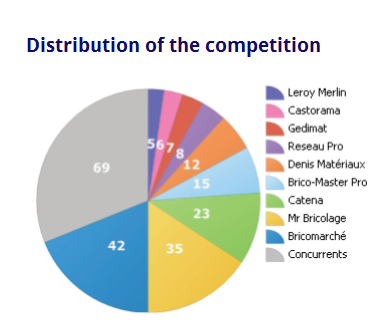
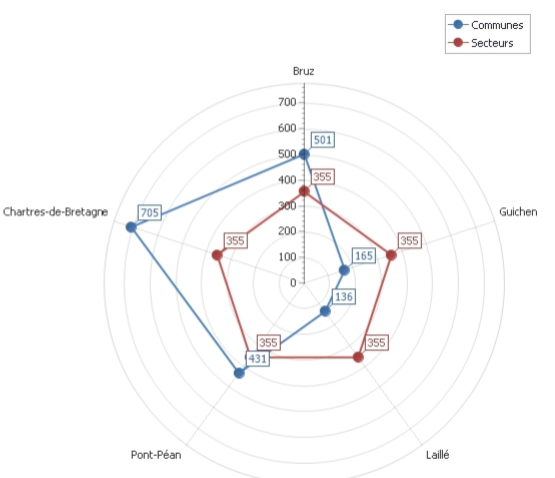
The brief examples of blocks given in this workshop are by no means exhaustive: it is also possible to manipulate graphs, circular diagrams, radar networks, or even more simply to date-stamp the reports produced. Reports is a product that is rich in resources, that covers all aspects necessary to the production of a complete and visually attractive study.
To take this a stage further, you can create different levels of reports within a single report model with a view to generating studies at various geographic levels (for example, if you want to set up an overview document for a particular region and its sectors, and then generate one map for each of the sectors automatically). To do this, you will need to insert a series of sub-reports within the main report.
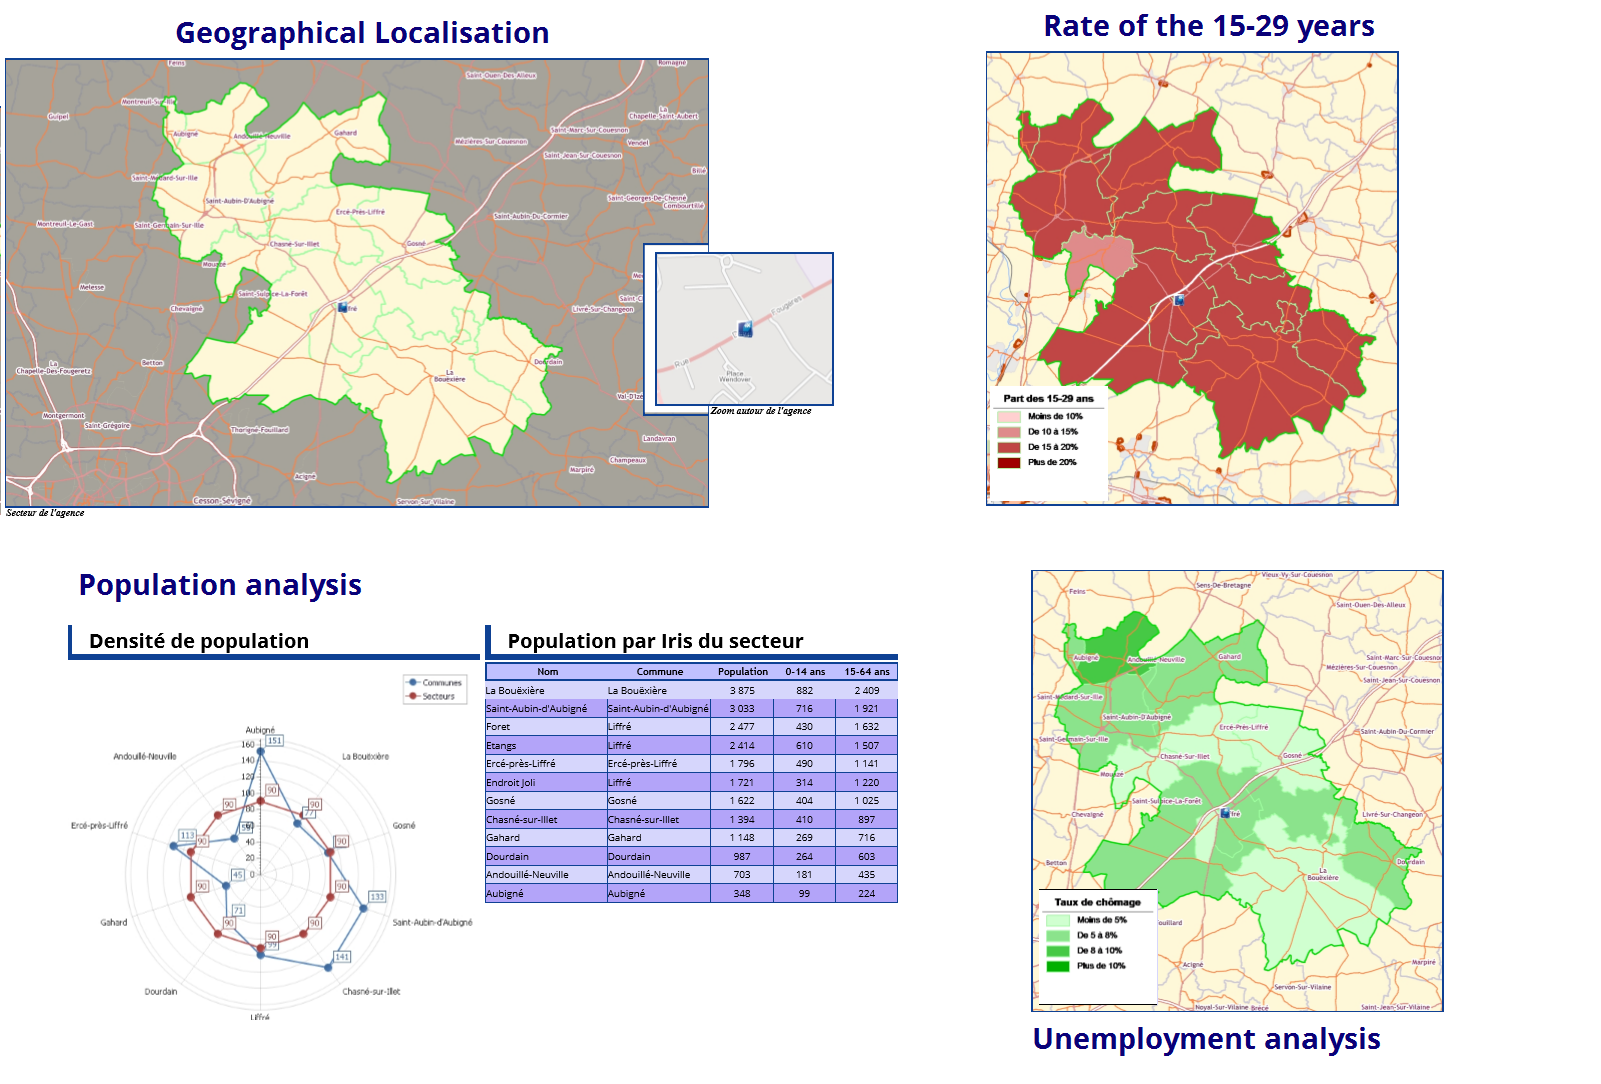
The report ready for you to download below (PDF) illustrate the some of the potential of using Reports to get your message across.
Are you ready? Start reporting!