Analysis of customer base and points of sale
Increase your marketing potential and efficiency: follow this scenario as a practical application to a typical geomarketing scenario.
To take the analysis one stage further : Download the the map so you can work through the exercises yourself

Workshop led by Christine Daniaud-Galet
This workshop will take place respecting the following stages:
Setting the scene
Telecoms operator L-lo Phone already has an established on-line presence, and is seeking to site its first mobile telephone store in one of the commercial centres in Paris and its inner suburbs, the key customer target being the local, working adult population.
With the aim of accurately targetting the best candidate commercial centre, our sample base stores 203 web-based customers of this operator, and this sample is considered to be representative of the company’s overall customer base.
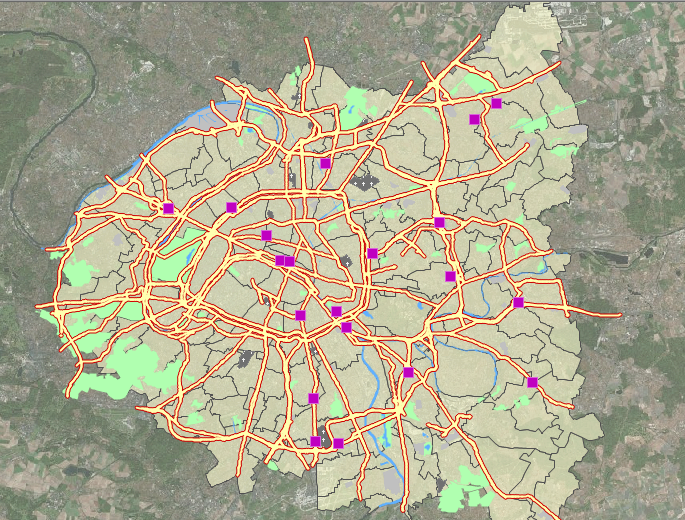
We also have 20 selected commercial centres selected as being suitable sites for the future Point Of Sale, spread over the 4 departments concerned: Paris, Hauts-de-Seine, Seine-Saint-Denis, and the Val-de-Marne.
The territory of action is located in Paris and in the inner Parisian conurbation and so Departments of Paris (75), Hauts-de-Seine (92), Seine-Saint-Denis (93) and Val-de-Marne (94) in a densely urbanised milieu.
Over and above the road network, the topographical elements, the commercial centres and the geographical outlines of the administrative entities, we can identify other elements such as points of interest, (police stations, underground stations… ) visible at larger map scales. The map is therefore made up of map objects.
Attribute data called Fields are associated to the graphical elements so data needed for the study overall are available to be used when needed. These information items are supplied by the cartographic database (OpenStreetMap) and INSEE.
Other information items will be calculated within the Geoconcept database to ensure the study is based on all the relevant data available.
Objective 1 : Explore the business and customer context for the study
Compose a formula
As you have two fields called Population and Area on towns (Communes objects) within the territory, you will create a new field that will calculate the population density. In the hierarchical tree of information layers, simply select the layer containing the new field (to define the field type as Real) before composing your formula:
( Population / Surface ) * 1 000 000 ==> the population density is therefore expressed in inhabitants per square kilometer (or km2).
Once you have validated the structure, consult the information added by gliding the cursor over the towns on the map, on condition that the relevant infoboxes have been configured in the toolbox.
The XVème district of Paris has a population density of 28 584,87 inhabitants per Km2.
Show your statistical data on the map (thematic analysis)
Having calculated the Population density field on towns featuring in the study territory, now we can map this theme in the form of a colour gradient to estimate the distribution of population for the area as a whole. The Thematic virtual layer will be created rapidly in Standard mode as a Colour ranges type layer. The operation breaks down into two steps:
- a discretisation of the statistical series, that is to say a breakdown into 5 ranges to reduce the information, choosing as a method the Equal fill method (roughly the same number of Town objects in each range). Each range will contain about 20% of the overall number of towns. Adjust the cursor to a value of 5;
- select the colour gradient by fine-tuning the slider to make the colours deeper or lighter shades as required.
Display the legend by opening the appropriate dialogue.
The highest densities concern Paris and the limitrophic towns. It is in this zone that our search for a site will be concentrated.
Following the same method as before, you can create different thematic analyses to map the 3 fields qualifying the towns:
- proportion of employed managers in the active population, with a blue colour gradient, having first broken down the population into 5 equal fill ranges;
- proportion of workers in the active population using the same discretisation method in shades of red;
- percentage of unemployed workers on the total population, with shades of yellow on the same discretisation method.
We can see a concentration of employed managers in the Western section of the territory, while workers have a higher weighting to the North, to the East, and to the South. The mapped unemployment rate is largely confined to towns to the North of the territory.
You can save these information layers in the form of visibilities and display the legends to analyse the distribution.
Objective 2: Enrich the work environment
importing addresses and geocoding
Importing a file of customers so you can measure their distribution on the map is a key step for any geomarketing study, but assumes you have the addresses of customers already stored.
Drag-and-drop the Excel file into the map and follow these steps:
- name the customer information layer
- indicate the geocoding repository needed to interpret the addresses
- assign a score to define the tolerance for the interpretation
- choose fine geocoding as a strategy for geocoding
- perform interactive error handling to remove any ambiguities among the candidates suggested for doubtful records
- validate your choice to view the records imported.
203 customers are imported into the map and positioned at their address. You can modify the appearance of any of them in the display manager.
.
Updating in Excel
Business data may be associated to customers that have already been imported into the map. You will enrich the Geoconcept database with a field that adds the average shopping basket for each customer. This information is contained in an Excel file from which you will update the Geoconcept map.
Next, you can:
- identify the customer with the biggest average shopping basket;
- view their location;
- calculate the average.
The customer number 10 located in the Paris X district has the biggest shopping basket, totalling €500.
Objective 3: Analyse local business activity
Calculate the number of customers per town
Once the customers have been positioned in each district and town of the Parisian inner urban hub, we will know the number of customers in each of these administrative entities.
This information is stored in a field on Communes (towns) objects that is calculated via a Topological join.
Select all the towns, and display the list, and you will be able to sort the items to identify the town with the most customers, the town with least customers, calculate the average of customers on the territory…
You will notice, with the Info-box, that Paris XV has only 2 customers and Issy-les-MMoulineaux, 3.
Estimate the penetration rate per town
You already have figures for the population and number of customers per town, and this allows creation of a new item of quantitative information: the penetration rate (Nb customers / Population).
Create a field associated to Communes objects (towns) that contains the formula, so that the value is systematically updated if the carrier fields are modified.
The mapped distribution of the penetration rate shows a disparity between the North and South of the territory.
You will see that in one of the towns having most customers, the Paris XX district, the penetration rate is 2.52, while at Rungis, the penetration rate is higher, standing at 34.91.
Measure the commercial centre closest to customers
To estimate the profitability of the commercial centres, you need to know which commercial centre is closest to each customer. You will need to load the graph of vehicle speeds, and then set parameters by loading and configuring the Vehicle profile, and performing the fastest calulation. You will then be able to add two fields to the customer objects:
- the first will indicate the closest commercial centre by road;
- the second will assess the time between each customer and their nearest commercial centre expressed in minutes and within a limit of 20 minutes.
You will see that many customers in the South West and North West are more than 10 minutes away from any commercial centre.
Locate the commercial centre with the highest footfall and disparity in geographic distribution
Since we have already identified the closest commercial centre for each customer, it is now easy to calculate the number of customers closest to each commercial centre, and who will therefore be that centre’s potential purchasing community. Starting from a key field, the value of which is identical between the two object layers, the name of a commercial centre on the one hand, and the value of the commercial centre closest to the customers on the other, you can perform an attribute junction that counts the number of customers ‘affiliated’ to a commercial centre.
Referring to the list created for the full list of customers and sorted on this new Nbcustomers field, you will see that the commercial centre that has the highest frequentation is number 3.
When you map this new value, the two commercial centres numbers 3 and 7 are affiliated to the highest number of customers at less than 20 minutes away.
Map profitability per town
Now it is time to identify which towns are profitable, that is to say, those where expenditure per customer is highest.
Start by performing a topological junction between towns and customers to create an Total average shopping basket field that calculates the sum of the average basket for each of the customers by town.
Next, in the map’s configurator, you will create another field called Profitability that divides the Average shopping basket calculated before by the Nb of customers per town.
Next, create a thematic analysis that maps this Profitability field. You will now see the towns where expenditure is highest and you can see there is a relative disparity over the whole of the territory.
Objective 4 : Create a spatial analysis of your territory
Construct catchment areas around the commercial centres
Select the commercial centres with the highest number of customers Commercial centres 3 and 7) to determine their respective catchment area in the form of an isochrone where all the points can be reached in less than 20 minutes via the road on the base of a road network that has been loaded beforehand.
The two areas show the influence of each of the shopping centers and visualize at a glance any anomalies.
Assess any possible cannibalisation
Can you identify a cannibalisation phenomenon between the 2 catchment areas?
An intersection zone between the 2 isochrones can be constructed to enable calculation of the average customer shopping basket for customers loated in the zone.
21 customers merit special attention, and the average shopping basket total amounts to 5738 euros in value.
When you take all the different elements of the conducted study, the best choice of an implantation site for the commercial activity is clearly the number 7.
Estimate the possibility of deploying a delivery service
Why not try testing out the idea of deploying a delivery service? The journey time taken for a driver from start to finish must not exceed 20 minutes.
Perform a test on customers in the Paris XIII district. Once you have selected the customers, declare them as stops along a route before assigning the status of the departure AND arrival points for commercial centre number 7. Run the route calculation for the fastest route and consult the route sheet.
This delivery route can be accomplished in approximately 10 minutes.
The validity of operator’s choice to site their new operation in commercial centre 7 is in this way confirmed.